Jua
Jua
Jua
Redesigning how Jua’s AI analyst answers energy traders, so each reply starts with the insight and keeps the data behind it in view.
Redesigning how Jua’s AI analyst answers energy traders, so each reply starts with the insight and keeps the data behind it in view.
← Back


An AI analyst for energy traders, redesigned to lead with the insight.
V2 redesign of the live Athena app, with demo data.
An AI analyst for energy traders, redesigned to lead with the insight.
V2 redesign of the live Athena app, with demo data.
Helping traders read a changing forecast
Helping traders read a changing forecast
Jua forecasts weather and power for energy markets, and Athena is the AI analyst that traders and meteorologists ask about those forecasts. I joined Jua as Lead Product Designer in February 2026 and worked on Athena until the end of April. The app had grown quickly through vibe-coding in Cursor, without a research, design or implementation process behind it, so it was slow, unstable and expensive to change.
Jua forecasts weather and power for energy markets, and Athena is the AI analyst that traders and meteorologists ask about those forecasts. I joined Jua as Lead Product Designer in February 2026 and worked on Athena until the end of April. The app had grown quickly through vibe-coding in Cursor, without a research, design or implementation process behind it, so it was slow, unstable and expensive to change.


My contribution
My contribution
At Jua I set up a product design process around application reviews, simplification and user research, and connected what we learned to priorities and the roadmap together with the CPO and CEO. We worked in one-week cycles. I redesigned the UI and UX, kept a modular Figma library, made React prototypes and worked directly in the app with Cursor. I also came up with the idea of putting widgets into Athena’s chat.
At Jua I set up a product design process around application reviews, simplification and user research, and connected what we learned to priorities and the roadmap together with the CPO and CEO. We worked in one-week cycles. I redesigned the UI and UX, kept a modular Figma library, made React prototypes and worked directly in the app with Cursor. I also came up with the idea of putting widgets into Athena’s chat.
After Jua, I took that chat work further in a V2 redesign of Athena’s answers, with its own design system, Calm. I made the V2 redesign with Claude and decided its colour, type and chart treatment. It uses demo data, and this page shows it next to the V1 screens for comparison.
After Jua, I took that chat work further in a V2 redesign of Athena’s answers, with its own design system, Calm. I made the V2 redesign with Claude and decided its colour, type and chart treatment. It uses demo data, and this page shows it next to the V1 screens for comparison.
Starting from the trader’s morning
Starting from the trader’s morning
I ran feedback sessions with energy traders and meteorologists, showed them changes and looked at the tools they already used. A meteorologist described a morning routine of 30 to 40 minutes in which building a dashboard through conversation was too slow, and a familiar view that was ready to read was more useful. Quantitative teams wanted forecasts and history through an API, and used conversation to investigate differences they did not expect. I organised the sessions around our weekly iterations, so each round of feedback shaped the next release.
I ran feedback sessions with energy traders and meteorologists, showed them changes and looked at the tools they already used. A meteorologist described a morning routine of 30 to 40 minutes in which building a dashboard through conversation was too slow, and a familiar view that was ready to read was more useful. Quantitative teams wanted forecasts and history through an API, and used conversation to investigate differences they did not expect. I organised the sessions around our weekly iterations, so each round of feedback shaped the next release.
Listening to users and redesigning around their needs raised perceived usability from 3/10 to an average of 7/10. The research also contributed to closed sales.
Listening to users and redesigning around their needs raised perceived usability from 3/10 to an average of 7/10. The research also contributed to closed sales.
View research session screenshot ↗


Putting the insight first in the chat
Putting the insight first in the chat
In V1, Athena answered in long, unstructured text with a lot of technical language, which made the main insight slow to find. I came up with the idea of putting charts, tables and interactive widgets into the chat, and shaped the answers so a trader finds the main insight first, can check the data behind it and then ask a focused follow-up.
In V1, Athena answered in long, unstructured text with a lot of technical language, which made the main insight slow to find. I came up with the idea of putting charts, tables and interactive widgets into the chat, and shaped the answers so a trader finds the main insight first, can check the data behind it and then ask a focused follow-up.
The V2 redesign follows one question a power trader might ask on a Thursday morning: what changed in German wind for tomorrow, and what should I watch? Athena answers in one sentence, 4.4 GW windier with the biggest lift in the morning, and places an annotated wind chart, the effect on the evening peak and the change by zone underneath.
The V2 redesign follows one question a power trader might ask on a Thursday morning: what changed in German wind for tomorrow, and what should I watch? Athena answers in one sentence, 4.4 GW windier with the biggest lift in the morning, and places an annotated wind chart, the effect on the evening peak and the change by zone underneath.


Giving larger analysis room on a canvas
Giving larger analysis room on a canvas
V1 already placed widgets on a canvas beside the chat. At Jua I specified that new widgets are added below the existing analysis, sized to their content, and leave the size and position of the others unchanged. In the V2 redesign, the chat builds and edits the canvas, and each numbered point in the answer matches the panel it explains.
V1 already placed widgets on a canvas beside the chat. At Jua I specified that new widgets are added below the existing analysis, sized to their content, and leave the size and position of the others unchanged. In the V2 redesign, the chat builds and edits the canvas, and each numbered point in the answer matches the panel it explains.


Comparing models hour by hour
Comparing models hour by hour
Traders compare several model runs at once. In V1 every line carried a long technical label with its model, run time and location, so the legend was hard to scan and took space from the chart. At Jua I grouped the forecasts by model, run and location in an interactive legend, with shorter dates and labels that expand on hover. This cut the vertical space used by legends by 55%.
Traders compare several model runs at once. In V1 every line carried a long technical label with its model, run time and location, so the legend was hard to scan and took space from the chart. At Jua I grouped the forecasts by model, run and location in an interactive legend, with shorter dates and labels that expand on hover. This cut the vertical space used by legends by 55%.
The V2 redesign takes the comparison further by placing wind, regional changes, residual load and model spread on one delivery-hour axis. A trader can follow 18:00 down through every signal and see that the evening relief, residual load falling from 27.1 to 22.7 GW, sits exactly where the models are already 7.2 GW apart.
The V2 redesign takes the comparison further by placing wind, regional changes, residual load and model spread on one delivery-hour axis. A trader can follow 18:00 down through every signal and see that the evening relief, residual load falling from 27.1 to 22.7 GW, sits exactly where the models are already 7.2 GW apart.


Keeping a quick check on the phone
Keeping a quick check on the phone
On a phone, each insight becomes its own card in the thread, led by the value that changed. A follow-up opens the model comparison for the evening, and the trader can set an alert for the next run without leaving the conversation.
On a phone, each insight becomes its own card in the thread, led by the value that changed. A follow-up opens the model comparison for the evening, and the trader can set an alert for the next run without leaving the conversation.


Creating Calm for long analytical answers
Creating Calm for long analytical answers
Calm is the design system behind the V2 redesign. It keeps Jua’s pink bright and mixes it into black, dark purple and dark blue for the surfaces. In charts, pink always means the newer run or the change, dashed lilac is the previous run and violet is disagreement between models, so a trader learns the code once and reads it on every screen.
Calm is the design system behind the V2 redesign. It keeps Jua’s pink bright and mixes it into black, dark purple and dark blue for the surfaces. In charts, pink always means the newer run or the change, dashed lilac is the previous run and violet is disagreement between models, so a trader learns the code once and reads it on every screen.


Widgets inside the chat have no outlines, and secondary data such as the previous run and the model range stays quieter, so the change itself stands out. I raised the faintest text, such as axis ticks, from about 3:1 to above the usual 4.5:1 contrast on every surface, and kept numbers together with their units.
Widgets inside the chat have no outlines, and secondary data such as the previous run and the model range stays quieter, so the change itself stands out. I raised the faintest text, such as axis ticks, from about 3:1 to above the usual 4.5:1 contrast on every surface, and kept numbers together with their units.


Testing the V2 redesign with traders
Testing the V2 redesign with traders
In research, speed remained a concern for time-sensitive morning work, and the V2 redesign does not solve that on its own. The next step is to put these screens in front of traders during their morning routine and see whether an answer that leads with the insight saves them the time a conversation costs.
In research, speed remained a concern for time-sensitive morning work, and the V2 redesign does not solve that on its own. The next step is to put these screens in front of traders during their morning routine and see whether an answer that leads with the insight saves them the time a conversation costs.
The idea of combining conversation with structured choices started earlier, in my KBC appointment-booking concept.
The idea of combining conversation with structured choices started earlier, in my KBC appointment-booking concept.
More work
Other case studies.
AI product · 2025
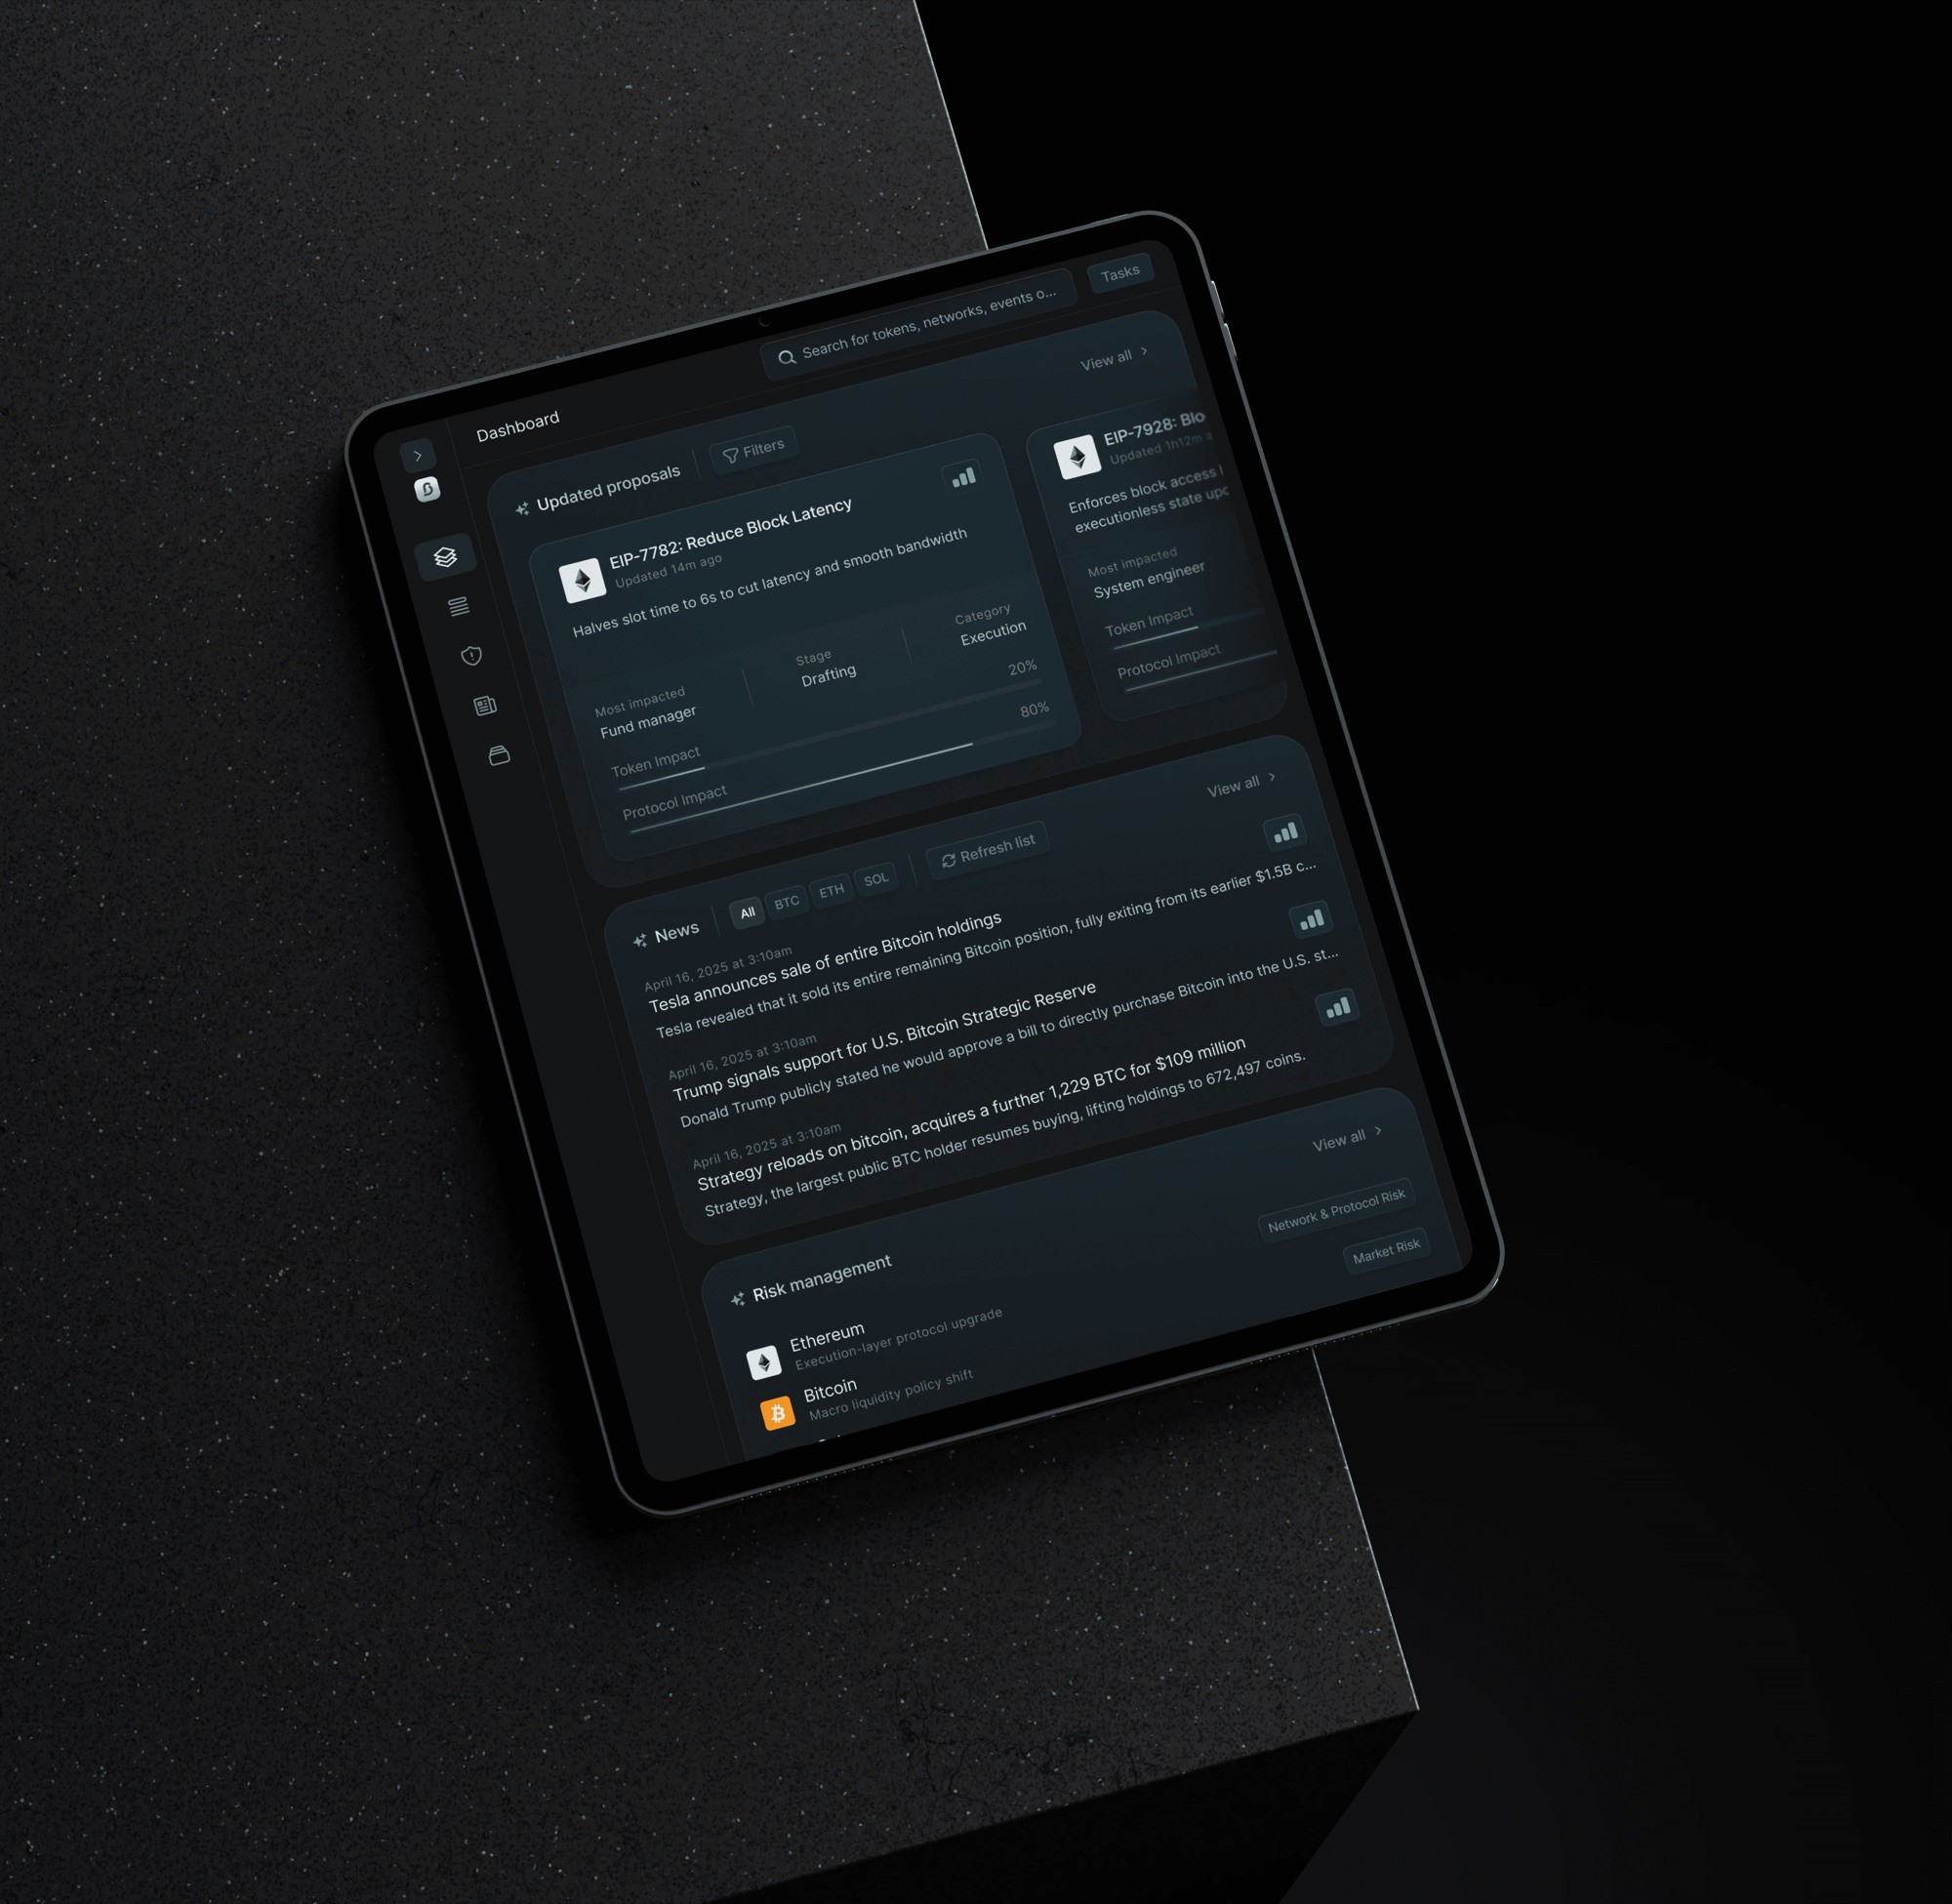
21Shares BlockSensai
Crypto governance and news intelligence for institutional teams.
Crypto intelligence for institutional teams.
View case studyView→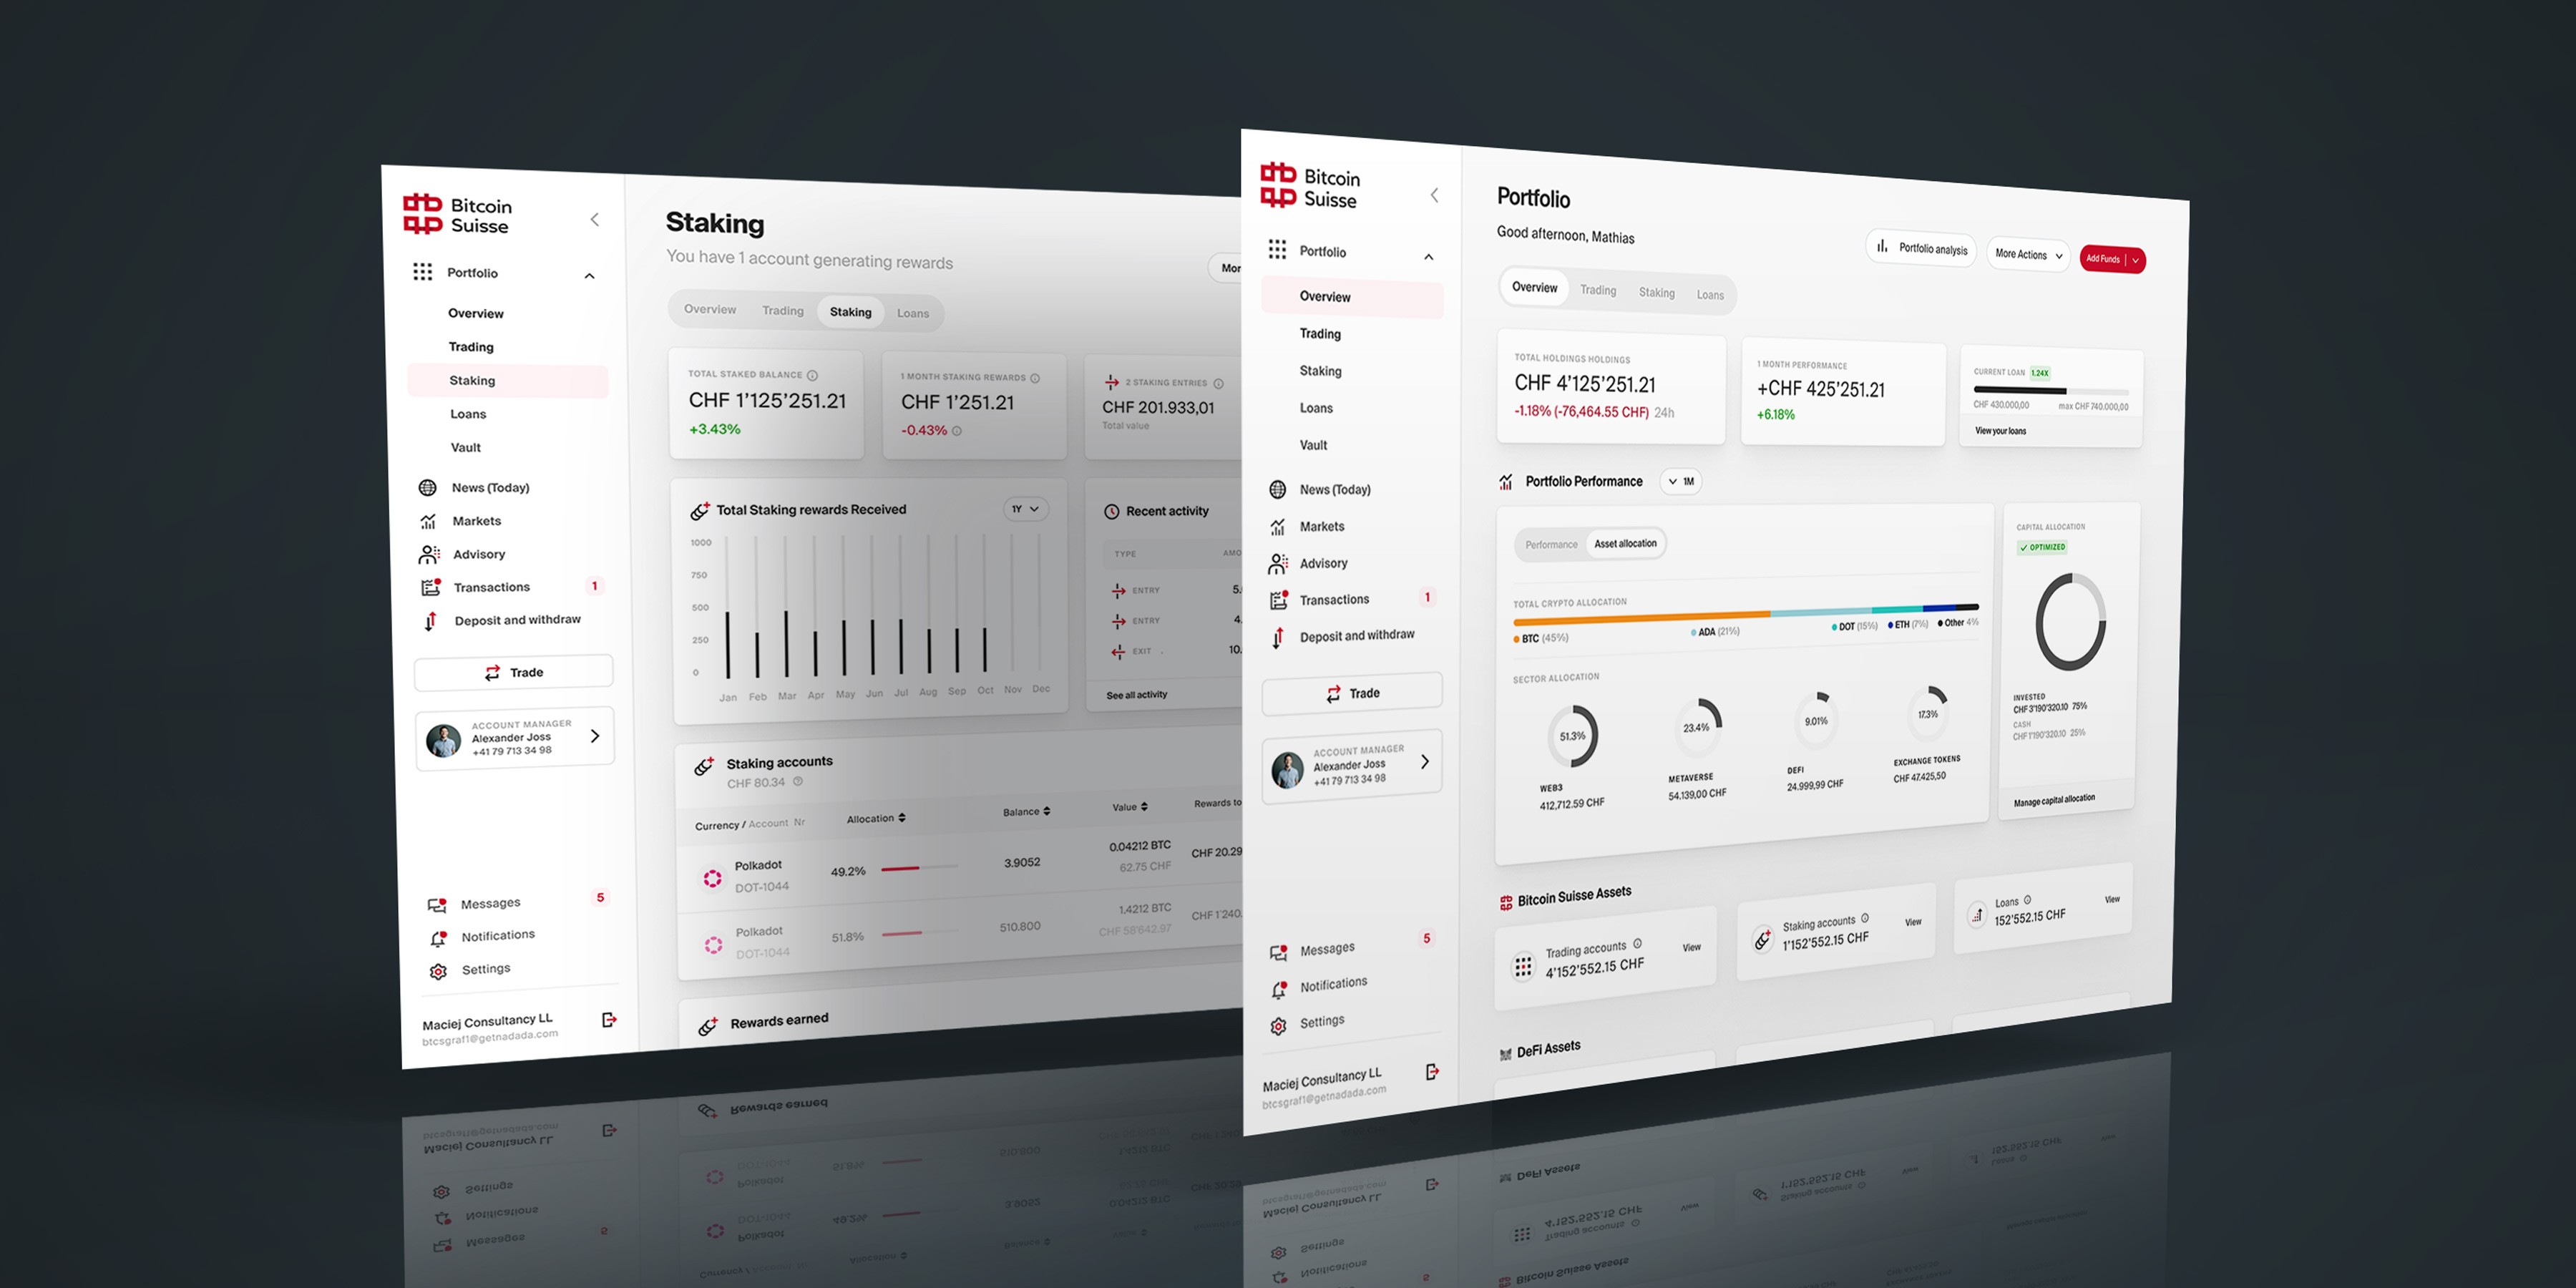
Portfolio redesign · 2023
Bitcoin Suisse
A unified model for holdings, accounts, performance and liabilities.
A unified model for holdings, accounts and performance.
View case studyView→
Investment platform · 2020–21
Credit Suisse
Responsive investment journeys backed by a better design and engineering delivery process.
Responsive journeys and a better delivery process.
View case studyView→